Shapefile showing active fault traces of seismic consern globally. The data is compilled as part of the GEM's global Probablistic Seismic Hazard modeling efforts. Includes infromation on fault type, n...
Map showing global seismic hazard areas. This Global Seismic Hazard Map depicts Peak
Ground Acceleration (PGA) with a 10% chance of exceedance in 50
years. The data is collected as part of the Globa...
Shapefile showing a lithological map of Africa differentiated by geologic time (intervals) made by the USGS (2001).
This dataset is part of the LEAP-RE project collection. For more information ...
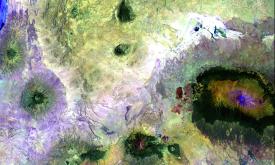
Map indicating locations of relatively high geothermal energy exploration potential where future research/analysis would likely yield the highest return on investement. The most favourable result, ass...
The least favourable result, assuming a clay poor sandstone (CP) compaction curve, of the Indicator analysis performed by Hofstra (2022/2023) TNO as part of this project. This map is created by projec...
The most favourable result, assuming a clay poor sandstone (CP) compaction curve, of the Indicator analysis performed by Hofstra (2022/2023) TNO as part of this project. This map is created by project...
The most favourable result, assuming a clay poor sandstone (CP) compaction curve, of the Indicator analysis performed by Hofstra (2022/2023) TNO as part of this project. This map is created by project...
The least favourable result, assuming a clay poor sandstone (CP) compaction curve, of the Indicator analysis performed by Hofstra (2022/2023) TNO as part of this project. This map is created by projec...
The least favourable result, assuming a clay poor sandstone (CP) compaction curve, of the Indicator analysis performed by Hofstra (2022/2023) TNO as part of this project. This map is created by projec...
The least favourable result, assuming a clay poor sandstone (CP) compaction curve, of the Indicator analysis performed by Hofstra (2022/2023) TNO as part of this project. This map is created by projec...
Air surface temperature of Africa derived from NASA, masked by the Africa plate shapefile.
Values are expressed in K.
This dataset is part of the LEAP-RE project collection. For more information...
Map showing the average continental surface temperature of the year 2022. This map was created by interpolating raw monthly satellite data to fill holes in the grids and subsequently adding and averag...