Conservation Tracking
- Cooling Absorption System;
- Refrigeration Absorption System;
- Binary ORC Power Plant;
- Flash Power Plant;
- Heat for Direct Use;
- Heat for High Temperature Heat Pump;
- base case scenario;
- upside scenario, modelling a better fluid flow;
- up up side, modelling both better fluid flow and higher underground temperatures.
- Direct Use;
- High Temperature Heat Pump;
- base case scenario;
- upside scenario, modelling a better fluid flow;
- up up side, modelling both better fluid flow and higher underground temperatures.
- base case scenario;
- upside scenario;
- up up side scenario.
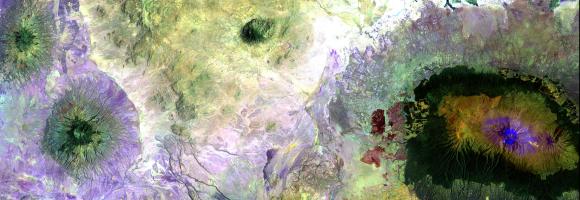
Based on the Geothermal Atlas for Africa , the temperature models at 1 km, 2 km, 3 km, and 4 km depth are part of a 3D conductive thermal model of the African lithosphere.
These layers can be described as follows:
- Model Basis: The layers are derived from a 3D grid with a vertical resolution of 250 meters down to 15 km, constructed using a lithosphere-scale conductive mode. This model incorporates sediment thickness, heat flow, crustal structure, and the depth of the Lithosphere-Asthenosphere Boundary (LAB).
- Calibration: The models are calibrated using a dataset of 923 filtered temperature observations from the British Geological Survey, which were averaged per model grid cell to improve data assimilation.
-
Environmental Adjustments:
- Surface Reference: The ETOPO surface level is used as the top reference level.
- Magmatic Areas: Magmatic areas have been treated as loci of elevated heat production at a depth range of 3 to 8 km, resulting in temperatures exceeding 200°C at 2 km depth.
- Application: These depth-specific temperature grids serve as primary inputs for assessing the technical performance of geothermal production scenarios across Africa, including direct heating, chilling, and power production (ORC).
Map showing the average continental surface temperature of the year 2022. This map was created by interpolating raw monthly satellite data to fill holes in the grids and subsequently adding and averaging the monthly surface temperatures of the year 2022. The data is clipped to only show the African continental region. The raw data is collected during the daytime by the Moderate Resolution Imaging Spectroradiometer (MODIS), an instrument on NASA's Terra and Aqua satellites. Please note that the type of "surface" MODIS measures varies as a function of location. In some places, the measurement represents the skin temperature of the bare land surface. In other places, the temperature represents the skin temperature of whatever is on the land-including snow and ice, or the leafy canopy of forests and crop fields, or human-made structures such as pavement and building rooftops.
Values are expressed in °C.
This dataset is part of the LEAP-RE project collection. For more information visit https://www.leap-re.eu/
This layer maps the distribution of diverse geothermal play types categorized by:
-
Location: Precise spatial boundaries of geothermal provinces.
-
Geodynamic Setting: Classification by tectonic regime.
-
Play Type: Categorization based on heat source and fluid transport mechanisms.
-
Energy Application: Indication of suitability for power production or direct-use applications.
This dataset provides the P50 projections for a geothermal system utilizing a Chiller unit.
Chiller refers to an absorption chiller or heat pump integrated into the geothermal system. It is used to provide cooling (by utilizing the geothermal heat) or to extract additional heat from the return fluid, thereby increasing the system's overall thermal harvest.
P50 is a statistical term used in risk analysis and forecasting. P50 represents the median scenario, meaning there is a 50% probability that the actual outcome will be higher than this value and a 50% probability it will be lower. It serves as the baseline "best estimate."
Metrics Definitions-
Coefficient of Performance (COP) [-]: A measure of efficiency, defined as the ratio of useful heating or cooling provided to the work (energy) required to operate the Chiller. Higher values indicate greater efficiency.
-
Doublet Net Production [MW]: The actual useful power output (Megawatts) generated by the "doublet" (one production well + one injection well), subtracting any energy used by pumps or auxiliary equipment.
-
Levelized Cost of Energy (LCOE) [US$ct/kWh]: The average revenue per unit of energy needed to recover the cost of building and operating the plant over its entire life cycle. It essentially represents the break-even price.
-
Net Present Value (NPV) [million US$]: The current financial value of all future cash flows the project will generate, minus the initial investment costs. A positive NPV generally indicates a profitable project.
-
Optimized Depth of the Aquifer [m]: The calculated ideal drilling depth (meters) to reach the geothermal reservoir that balances drilling costs with temperature/flow benefits.
- Pressure needed to drive pumps [Bar]: The total pressure difference required to drive the thermal loop through the reservoir and wellbore.
-
Production Flow Rate [m³/h]: The volume of geothermal fluid extracted from the reservoir per hour (cubic meters per hour).
-
Temperature at Reservoir [°C]: The natural temperature (Celsius) of the geothermal fluid within the subsurface rock formation before it is brought to the surface.
-
Transmissivity [Dm]: A measure of how easily fluid flows through the porous aquifer. It is the product of hydraulic conductivity and aquifer thickness (often measured in Darcy-meters). High transmissivity means easier extraction.
-
Well Distance [m]: The physical distance (meters) between the production well (extraction) and the injection well (return). Proper spacing prevents "short-circuiting," where cool injected water lowers the temperature of the production well too quickly.
This dataset provides the P50 projections for a Direct Heat geothermal system.
Direct Heat refers to the use of geothermal energy for applications such as space heating, industrial processes, or agriculture. In the utilized model, it is assumed a minimum production temperature of at least 60°C and a reinjection temperature of 40°C.
P50 is a statistical term used in risk analysis and forecasting. P50 represents the median scenario, meaning there is a 50% probability that the actual outcome will be higher than this value and a 50% probability it will be lower. It serves as the baseline "best estimate."
Metrics Definitions-
Coefficient of Performance (COP) [-]: A measure of efficiency, defined as the ratio of useful heating or cooling provided to the work (energy) required to operate the Chiller. Higher values indicate greater efficiency.
-
Doublet Net Production [MW]: The actual useful power output (Megawatts) generated by the ""doublet"" (one production well + one injection well), subtracting any energy used by pumps or auxiliary equipment.
-
Levelized Cost of Energy (LCOE) [US$ct/kWh]: The average revenue per unit of energy needed to recover the cost of building and operating the plant over its entire life cycle. It essentially represents the break-even price.
-
Net Present Value (NPV) [million US$]: The current financial value of all future cash flows the project will generate, minus the initial investment costs. A positive NPV generally indicates a profitable project.
-
Optimized Depth of the Aquifer [m]: The calculated ideal drilling depth (meters) to reach the geothermal reservoir that balances drilling costs with temperature/flow benefits.
- Pressure needed to drive pumps [Bar]: The total pressure difference required to drive the thermal loop through the reservoir and wellbore.
-
Production Flow Rate [m³/h]: The volume of geothermal fluid extracted from the reservoir per hour (cubic meters per hour).
-
Temperature at Reservoir [°C]: The natural temperature (Celsius) of the geothermal fluid within the subsurface rock formation before it is brought to the surface.
-
Transmissivity [Dm]: A measure of how easily fluid flows through the porous aquifer. It is the product of hydraulic conductivity and aquifer thickness (often measured in Darcy-meters). High transmissivity means easier extraction.
-
Well Distance [m]: The physical distance (meters) between the production well (extraction) and the injection well (return). Proper spacing prevents ""short-circuiting,"" where cool injected water lowers the temperature of the production well too quickly.
This dataset provides the P50 projections for a Direct Heat with Heat Pump geothermal system.
Direct Heat with Heat Pump refers to a scenario where a geothermal system is integrated with an industrial heat pump to upgrade low-grade heat. This allows for production from geothermal temperatures as low as 40°C, which are then heated by the pump to a delivery temperature of 80°C. The reinjection temperature is set to the production temperature minus 20°C, with a absolute minimum of 15°C.
P50 is a statistical term used in risk analysis and forecasting. P50 represents the median scenario, meaning there is a 50% probability that the actual outcome will be higher than this value and a 50% probability it will be lower. It serves as the baseline ""best estimate.""
Metrics Definitions-
Coefficient of Performance (COP) [-]: A measure of efficiency, defined as the ratio of useful heating or cooling provided to the work (energy) required to operate the Chiller. Higher values indicate greater efficiency.
-
Doublet Net Production [MW]: The actual useful power output (Megawatts) generated by the ""doublet"" (one production well + one injection well), subtracting any energy used by pumps or auxiliary equipment.
-
Levelized Cost of Energy (LCOE) [US$ct/kWh]: The average revenue per unit of energy needed to recover the cost of building and operating the plant over its entire life cycle. It essentially represents the break-even price.
-
Net Present Value (NPV) [million US$]: The current financial value of all future cash flows the project will generate, minus the initial investment costs. A positive NPV generally indicates a profitable project.
-
Optimized Depth of the Aquifer [m]: The calculated ideal drilling depth (meters) to reach the geothermal reservoir that balances drilling costs with temperature/flow benefits.
- Pressure needed to drive pumps [Bar]: The total pressure difference required to drive the thermal loop through the reservoir and wellbore.
-
Production Flow Rate [m³/h]: The volume of geothermal fluid extracted from the reservoir per hour (cubic meters per hour).
-
Temperature at Reservoir [°C]: The natural temperature (Celsius) of the geothermal fluid within the subsurface rock formation before it is brought to the surface.
-
Transmissivity [Dm]: A measure of how easily fluid flows through the porous aquifer. It is the product of hydraulic conductivity and aquifer thickness (often measured in Darcy-meters). High transmissivity means easier extraction.
-
Well Distance [m]: The physical distance (meters) between the production well (extraction) and the injection well (return). Proper spacing prevents ""short-circuiting,"" where cool injected water lowers the temperature of the production well too quickly.
This dataset provides the P50 projections for an Organic Rankine Cycle (ORC) geothermal power plant.
Organic Rankine Cycle (ORC) refers to a binary power plant configuration where geothermal fluid (brine) is used to heat a secondary organic working fluid. This process allows for efficient electricity generation from medium-to-low temperature resources (typically 90°C to 150°C). The organic fluid vaporizes, drives a turbine, and is then condensed back into a liquid to repeat the cycle. The geothermal brine is reinjected into the reservoir after passing through the heat exchanger.
P50 is a statistical term used in risk analysis and forecasting. P50 represents the median scenario, meaning there is a 50% probability that the actual outcome will be higher than this value and a 50% probability it will be lower. It serves as the baseline ""best estimate.""
Metrics Definitions-
Coefficient of Performance (COP) [-]: A measure of efficiency, defined as the ratio of useful heating or cooling provided to the work (energy) required to operate the Chiller. Higher values indicate greater efficiency.
-
Doublet Net Production [MW]: The actual useful power output (Megawatts) generated by the ""doublet"" (one production well + one injection well), subtracting any energy used by pumps or auxiliary equipment.
-
Levelized Cost of Energy (LCOE) [US$ct/kWh]: The average revenue per unit of energy needed to recover the cost of building and operating the plant over its entire life cycle. It essentially represents the break-even price.
-
Net Present Value (NPV) [million US$]: The current financial value of all future cash flows the project will generate, minus the initial investment costs. A positive NPV generally indicates a profitable project.
-
Optimized Depth of the Aquifer [m]: The calculated ideal drilling depth (meters) to reach the geothermal reservoir that balances drilling costs with temperature/flow benefits.
- Pressure needed to drive pumps [Bar]: The total pressure difference required to drive the thermal loop through the reservoir and wellbore.
-
Production Flow Rate [m³/h]: The volume of geothermal fluid extracted from the reservoir per hour (cubic meters per hour).
-
Temperature at Reservoir [°C]: The natural temperature (Celsius) of the geothermal fluid within the subsurface rock formation before it is brought to the surface.
-
Transmissivity [Dm]: A measure of how easily fluid flows through the porous aquifer. It is the product of hydraulic conductivity and aquifer thickness (often measured in Darcy-meters). High transmissivity means easier extraction.
-
Well Distance [m]: The physical distance (meters) between the production well (extraction) and the injection well (return). Proper spacing prevents ""short-circuiting,"" where cool injected water lowers the temperature of the production well too quickly.
This dataset provides a continent-wide, raster-based spatial representation of groundwater resources across Africa for the year 2011, modeled under a historical baseline climate scenario. It is designed to support researchers, policymakers, and practitioners in mapping water availability, understanding baseline hydrogeological conditions, and assessing the intersection of natural water resources with climate and energy planning.
Sources and ContextThis layer was extracted from the Africa Groundwater Atlas of the British Geological Survey (BGS) in collaboration with the International Association of Hydrogeologists (IAH). The Atlas provides the expert continent-scale evidence base—including aquifer type, productivity, and groundwater status across 51 African countries—that makes robust spatial modeling of this kind possible.
This layer is part of the Geothermal Atlas for Africa developed within the LEAP-RE project

Monitoring of sea surface temperature (SST) provides fundamental information on the global climate system and for the study of marine ecosystems. This layer compares the SST value of the last full month with the long-term mean SST. A positive anomaly (warm colours) means the monthly SST is warmer than the long-term average for that month; a negative anomaly (cool colours) means it is cooler than the average.
This dataset is part of the LEAP-RE project collection. For more information visit https://www.leap-re.eu/
- base case scenario;
- upside scenario;
- up up side scenario.
- Cooling Absorption System;
- Refrigeration Absorption System;
- base case scenario;
- upside scenario, modelling a better fluid flow;
- up up side, modelling both better fluid flow and higher underground temperatures.
- Binary ORC Power Plant;
- Flash Power Plant;
- base case scenario;
- upside scenario, modelling a better fluid flow;
- up up side, modelling both better fluid flow and higher underground temperatures.
This dataset maps regions across Africa with high geothermal energy exploration potential, identifying areas where further research and investment are most likely to yield significant returns. The mapping represents a synthesis of the Indicator Analysis performed by TNO (Hofstra, 2023), specifically selecting the most and least favorable technical outcomes under the assumption of a clay-poor sandstone (CP) compaction model.
To ensure structural robustness and account for geological uncertainty, the indicator results have been projected onto four distinct geological basin models:
- BGS TARGET Model: Projecting indicator values onto basin shapefiles defined by the British Geological Survey.
- Evenick Model: Utilizing sedimentary basin structures characterized by surface porosity and thickness according to Evenick’s framework.
- Getech Model: Integrating regional basin delineations to refine spatial prospectivity based on gravity and crustal structure data.
- Robertson CGG Model: Applying indicator analysis to high-resolution basin geometries to evaluate technical performance.
Key Indicators & Methodology
The favorable results displayed in these maps are derived from a multi-criteria evaluation which includes:
- Thermal Performance: Integration of the 3D conductive thermal model to identify viable reservoir temperatures at depth.
- Reservoir Quality: Assessment of potential hydraulic transmissivity based on depth-dependent porosity and permeability for sedimentary aquifers.
- Economic Viability: Calculations involving the Levelized Cost of Energy (LCOE) to distinguish areas where energy extraction is most cost-effective.
This layer is part of the Geothermal Atlas for Africa developed within the LEAP-RE project.
This dataset maps the critical structural and tectonic features across Africa that serve as key indicators for geothermal resource potential. These layers delineate "fault/fracture zones" which are considered a primary geothermal resource play type for both magmatic and non-magmatic settings.
The layers in the dataset are:
- Active faults (BGS) – derived from the Trans-African Regional Geo-data for the Energy Transition (TARGET) model of the British Geological Survey;
- Active Faults GEM) – compilled as part of the GEM's global Probablistic Seismic Hazard modeling efforts;
- Major faults – derived from the Trans-African Regional Geo-data for the Energy Transition (TARGET) model of the British Geological Survey;
- Major faults - East-African Rift System - showing the location of major faults in the East-African Rift System, derived from Chrowicz (2005), part of the East African Rift Temperature and Heat flow model (EARTH).
These fault layers are crucial for characterizing subsurface hydraulic properties. Specifically, the dataset's features are utilized to:
- Determine Permeability and Transmissivity: Active fault zones are modeled to have high fault/fracture permeability, accounting for a hydraulic transmissivity of 20 Darcy-meters up to a depth of 3 km.
- Define Reservoir Thickness: For performance calculations, the corresponding "aquifer" permeability within these active fault zones is set to 10,000 mDarcy with an assumed thickness of 20 meters.
- Model Geothermal Production: These structural features are integrated into the "resource fast model" as thin reservoirs for geothermal doublet systems (systems with at least one production and one injection well) situated in fractured basement or sedimentary rock.
- Support Spatial Analysis: The locations of these active faults are rasterized and combined with 3D temperature grids (where magmatic areas and active volcanoes exhibit elevated heat production) to calculate local geothermal energy conversion scenarios across the continent.
- base case scenario;
- upside scenario;
- up up side scenario.
This dataset comprises a collection of shapefiles detailing the geographical locations and attributes of various wells across Africa, with a strong focus on geothermal exploration and assessment. Together, these layers offer a valuable resource for geothermal energy planning, subsurface geological analysis, and infrastructure mapping. The collection includes the following spatial data layers:
- Wells: Maps the locations of various existing well types and provides critical geothermal metrics where available, including well names, temperature correction states, thermal gradients, heat flow, and heat production data.
- BGS Well: A compiled spatial layer derived from scientific literature that categorizes well locations and types.
- Planned wells: Highlights the prospective locations of future geothermal wells across the continent.
These layers are part of the Geothermal Atlas for Africa developed within the LEAP-RE project"