This selection of analytical tools allows you to interact with detailed maps and statistics. All tools are relevant to all African countries, and some have a global dimension.
The conservation analyst is a web-based tool that integrates and weighs multiple criteria for spatial conservation planning allowing for the identification and selection of unprotected la...
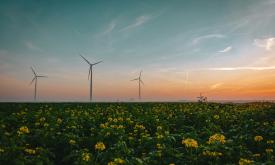
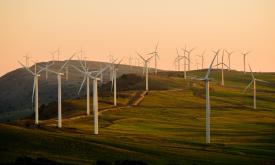
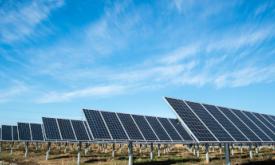
The Clean Energy Access Prioritiser (CEAP) is an open-source decision-support tool designed to identify priority areas for clean energy interventions and investments. ...
The Integrated Management Effectiveness Tool (IMET) is a decision-support tool intended to develop the planning-monitoring-evaluation process to improve protected areas (PA) management ef...
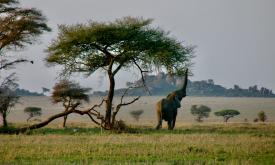
Protected areas in Africa play a critical role in biodiversity conservation, supporting livelihoods, and mitigating climate change. This tool offers a comprehensive analysis of the dynami...
The Clean Energy Access Prioritiser (CEAP) is an open-source decision-support tool designed to identify priority areas for clean energy interventions and investments. ...
The Clean Energy Access (CEA) is an analytical tool developed to provide geospatial context to electricity access in Africa@and specifically to factors that influence the deployment of de...
Dashboard design by Amy Wootton - Esri South Africa. The Armed Conflict Location and Event Data Project (ACLED) is a publicly available conflict event dataset designed for disaggregated c...
The IPC Mapping Tool is an enhanced interactive interface that shows a map of all the countries the IPC works in and allows you to download population data.