Energy

Displaying 1 - 15 of 83
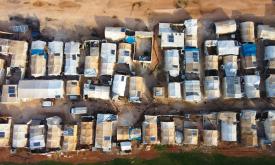
All known formal and informal settlements of forcibly displaced and stateless people in Africa from UNHCR’s GIS database as of November 2025. Population in the settlement. It may include several categories: Refugees, Returnees, IDP, Asylum-seeker, Stateless and Mixed.Formal Settlement: Formal settlements are places where official land is allocated for a group of asylum seekers, refugees, or IDPs. They are accommodated in purpose-built settlements with access to facilities and services. An official management entity is assigned. Camps are a type of formal settlement. Informal Settlement: In an informal settlement, a group of asylum-seekers, refugees, or IDPs choose to settle in self-identified spontaneous sites. Self-settled settlements are often located on state-owned, private, or communal land, with or without negotiations with the local population or private landowners.
This layer represents the predicted likelihood that a given settlement is electrified, with values ranging from 0 (no electricity) to 1 (fully electrified). The data are derived from the High Resolution Electricity Access (HREA) dataset, which combines satellite observations of night-time lights with population settlement layers to estimate electricity access. Areas with low predicted electrification can help identify where decentralized renewable energy solutions may be most impactful in closing electricity access gaps.
The dataset depicts the total energy demand per settlement (kWh/day) at year 5 under scenario with household consumption raised to 1000 Wh/day (at year 0). This dataset is part of the e Refugee Settlements Electricity Access (RSEA) database, designed and developed to gather the multidimensional factors that can determine a refugee settlement's energy dimension. These factors were chiefly environmental (such as variability of solar radiation and avoided GHG emissions), technical (electrification status, distance to grid), social (population, electricity demand, social infrastructure), and economic (e.g., PV mini-grid component prices) considerations that can influence a stakeholder decision on the deployment of a PV and battery storage mini-grid in a displacement setting.
Distance from existing or planned electric grid lines (LV; MV; HV). Unit: km

The Clean Energy Access Prioritiser (CEAP) is an open-source decision-support tool designed to identify priority areas for clean energy interventions and investments.  The spatial planning tool allows users to evaluate clean energy projects with a multi-sectoral approach, including environmental, socio-economic, cultural, and political aspects. 

Estimated number of jobs created directly related to the deployment of PV mini-grids. The indicator was calculated using data on the total MWh of electricity output anticipated if the total number of potential mini-grids were established within each country and the employment factors come from OECD. If the estimated number of jobs created is high, it means that PV mini-grids have a large potential both in terms of deployment and social development.
The International Wealth Index is an asset-based wealth index that runs from 0 (no assets) to 100 (all assets) and is comparable across place and time. The lower the level of the Index, the greater the potential of electricity access to reduce poverty and foster development.
Average time spent by households on fuel collection daily. The higher the number of daily hours that households spend in collecting fuel, the higher the improvements in the quality of life of communities due to electricity access.
Percentage of women who worked in the 12 months preceding the survey and are working currently. A lower score reflects weaker female emancipation within the labour market, and thus a higher potential impact of electricity access for improving women empowerment.
Number of maternal deaths during a given time period per 100 000 live births during the same time period. The lower the number of healthcare facilities with access to electricity the greater the potential for decentralised renewable energies to reduce maternal mortality.
Percentage of women who experienced physical or sexual violence. This indicator focuses on the importance of bringing electricity to public infrastructures, in particular streets. Improving street lighting can make these infrastructures safer especially for women and thus reduce the number of women who experienced any type of violence in public spaces.
Percentage of cohort of young people three to five years older than the intended age for the last grade of upper secondary level of education who have completed that level of education. This indicator measures the potential impact of electricity on youth education, that represents a crucial pillar for the development of a country.
Percentage of schools in Africa reporting to have no electricity. The lower the education facilities with access to electricity the greater the potential for decentralised renewable energies to improve electricity access in these facilities and thus educational outcomes.
Percentage of women who are literate. This indicator highlights the importance of electricity for women, who spend the majority of their time taking care of the households. Electricity can ease girls and young women from houdeholds duties and allow them to attend schools. Thus, the lower the number of households with access to electricity the greater the potential for decentralised renewable energies to improve literacy levels among women.
The current version of the GDW database (version 1.0) aims to catalogue all types of anthropogenic instream barriers. While initial mapping efforts prioritize major dams that form reservoirs, as well as run-of-river barriers on larger rivers where more information is readily available, the dataset comprises two distinct but interconnected spatial layers: Barrier and Dam Locations (Point Layer): Contains barrier and dam locations, geospatially referenced as point coordinates and co-registered to the global river network of HydroSHEDS. Reservoir Extents (Polygon Layer): Contains associated reservoir polygons, which includes data representing the maximum storage capacity of the reservoirs measured in million cubic meters.