This layer represents the estimated travel time (in hours) by foot to the nearest primary school. The accessibility map is generated using a well-established geospatial methodology that integrates roa...
This layer represents the estimated travel time (in hours) by foot to the nearest healthcare facility. The underlying methodology is described in Weiss et al. (2020), which leverages major data collec...
The current version of the GDW database (version 1.0) aims to catalogue all types of anthropogenic instream barriers. While initial mapping efforts prioritize major dams that form reservoirs, as well ...
Percentage of children in a school attendance age (approximately 3-17 years old depending on the country) that have internet connection at home. Also in this case the indicator relates to the potentia...
Shapefile showing the location of powerplants along the East-African rift system, derived from the World Bank Transmission and distribution: Energy Atlas (ARDERNE, C. 2017)
This dataset is part...
Shapefile showing the location and voltage of the electricity grid network of some parts of Africa.
This dataset is part of the LEAP-RE project collection. For more information visit https://ww...
This data represents the total built-up volume between 1975 and 2030 in 5 year intervals over cells of 1x1 km size.
It derives from the GHS-BUILT-V - R2023A spatial raster dataset, that depicts t...
These layers present the application of the Degree of Urbanisation stage I methodology recommended by UN Statistical Commission to the global population grid generated by the JRC in the epochs 1975-20...
This data represents the distribution of human population between 1975 and 2030 in 5 year intervals over cells of 1x1 km size.
It derives from the GHS-POP - R2023A.
Residential population estimat...
This data represents the distribution of human population between 1975 and 2030 in 5 year intervals over cells of 100x100 m size.
It derives from the GHS-POP - R2023A.
Residential population esti...
Africa is projected to have the fastest urban growth rate in the world — by 2050, Africa’s cities will be home to an additional 950 million people. Urban planning and management are essential developm...
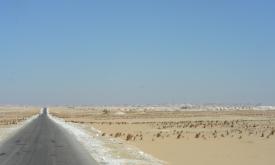
The world is shrinking. Cheap flights, large scale commercial shipping and expanding road networks all mean that we are better connected to everywhere else than ever before. Accessibility - whether it...
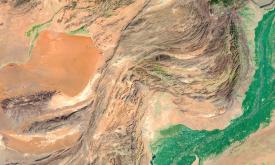
The human imprint on the planet has a major impact on the functioning of the Earth system. Because the impact on the environment is closely intertwined with population dynamics, it is important to mon...
This dataset provides mobile (cellular) network performance metrics in zoom level 16 web Mercator tiles (approximately 610.8 meters by 610.8 meters at the equator). Download speed is collected via the...
This dataset provides fixed broadband performance metrics in zoom level 16 web Mercator tiles (approximately 610.8 meters by 610.8 meters at the equator). Download speed is collected via the Speedtest...