Water

Title: Africa Regional Centres of Excellence - ArcX: Water Component. 

Main Objective: Strengthen water governance and resilience in Sub-Saharan Africa through research, capacity building, and inclusive solutions for sustainable water resource management and equitable access to WASH services.

Specific Objectives:

  1. Conduct research on climate, hydrology, and the Water–Energy–Food–Ecosystem (WEFE) nexus;
  2. Provide science-based recommendations for water management and environmental risk reduction;
  3. Develop human capacity through training and mobility programmes for young professionals.

Starting Year: 2024
Implementation Duration: 48 months

Areas of Impact:

  1. Hydrology and Climate: Studies on surface and groundwater under changing climatic conditions;
  2. Water Management: Policy and decision-support for transboundary basin management;
  3. WEFE Nexus: Cross-sectoral linkages among water, energy, food, and ecosystems;
  4. WASH: Equitable access to water, sanitation, and hygiene services with gender-sensitive delivery mechanisms.

Target Groups: AUDA-NEPAD Networks of Water Centres of Excellence, regional organisations, river basin authorities, policy stakeholders, service providers, young professionals, and end-users.

ArcX Partners: See ArcX Partners card and the ArcX Partnership Map.

Component Coordinator: University of Stellenbosch.

Leading Regional Centre of Excellence (RCoE): University of Stellenbosh

Scientific and Technical Support from EC - DG JRC: JRC Unit D2 (Ocean & Water).


Available Resources
Displaying 1 - 15 of 19
This layer shows the percentage of people with access to any improved sanitation facility, including both piped systems (such as sewer or septic tanks) and non-piped improved options (like ventilated improved pit latrines or composting toilets), in 2017. Improved sanitation is essential for public health, reducing the spread of waterborne diseases and supporting safe and dignified living conditions. Areas with low access highlight the need for expanded basic services and targeted investments in infrastructure.
Access to piped water reflects the availability of improved water sources directly delivered to households. This layer shows the percentage of people with access to piped water in 2017. Low coverage may signal the need for targeted interventions, potentially supported by decentralized energy systems to power water pumping and distribution.
All known formal and informal settlements of forcibly displaced and stateless people in Africa from UNHCR’s GIS database as of November 2025. Population in the settlement. It may include several categories: Refugees, Returnees, IDP, Asylum-seeker, Stateless and Mixed.Formal Settlement: Formal settlements are places where official land is allocated for a group of asylum seekers, refugees, or IDPs. They are accommodated in purpose-built settlements with access to facilities and services. An official management entity is assigned. Camps are a type of formal settlement. Informal Settlement: In an informal settlement, a group of asylum-seekers, refugees, or IDPs choose to settle in self-identified spontaneous sites. Self-settled settlements are often located on state-owned, private, or communal land, with or without negotiations with the local population or private landowners.
Reference evapotranspiration (Global - Monthly - ~10 km) August 2025- AQUASTAT (FAO) AgERA5 derived. Reference evapotranspiration per month with a spatial resolution of 0.1 degree. Unit: mm month-1. The dataset contains monthly values for global land areas, excluding Antarctica, since 1979. The dataset has been prepared according to the FAO Penman - Monteith method as described in FAO Irrigation and Drainage Paper 56. https://data.apps.fao.org/catalog/dataset/c91430cc-681e-4ca8-a5f4-8c97dc92c547/resource/ff49908e-2e07-48b3-8deb-0c69af411859
Water Footprint in Africa, considered as the sum of both the green and blue WF and defined as the ratio between evapotranspiration (in m3 per hectare) and crop yield (in ton per hectare). The values are expressed in m3/ton.
The current version of the GDW database (version 1.0) aims to catalogue all types of anthropogenic instream barriers. While initial mapping efforts prioritize major dams that form reservoirs, as well as run-of-river barriers on larger rivers where more information is readily available, the dataset comprises two distinct but interconnected spatial layers: Barrier and Dam Locations (Point Layer): Contains barrier and dam locations, geospatially referenced as point coordinates and co-registered to the global river network of HydroSHEDS. Reservoir Extents (Polygon Layer): Contains associated reservoir polygons, which includes data representing the maximum storage capacity of the reservoirs measured in million cubic meters.
This dataset provides a continent-wide, raster-based spatial representation of groundwater resources across Africa for the year 2011, modeled under a historical baseline climate scenario. It is designed to support researchers, policymakers, and practitioners in mapping water availability, understanding baseline hydrogeological conditions, and assessing the intersection of natural water resources with climate and energy planning. Sources and Context This layer was extracted from the Africa Groundwater Atlas of the British Geological Survey (BGS) in collaboration with the International Association of Hydrogeologists (IAH). The Atlas provides the expert continent-scale evidence base—including aquifer type, productivity, and groundwater status across 51 African countries—that makes robust spatial modeling of this kind possible. This layer is part of the Geothermal Atlas for Africa developed within the LEAP-RE project
Surface water affects many aspects of our world: the exchange of heat, gas and water vapour between the planet's surface and atmosphere. Water is the engine behind the distribution, movement and migration of Earth's plant and animal life and is just as essential for humans. It affects our capacity to grow crops and manage animal grazing lands, to run our industrial processes, to manufacture goods, it influences the movement of disease-vectors, toxins and pollutants, it generates energy directly (hydroelectric) and indirectly (thermoelectric), it is an essential part of our transport network, and forms part of our recreational, cultural and sporting world. The Water Occurrence dataset shows where surface water occurred between 1984 and 2018. Open water is any stretch of water open to the sky, and includes both freshwater and saltwater. The map displays water surfaces greater than 30m2 that are visible from space, including natural (rivers, lakes, coastal margins and wetlands) and artificial water bodies (reservoirs formed by dams, flooded areas such as opencast mines and quarries, flood irrigation areas such as paddy fields, and water bodies created by hydro-engineering projects such as waterway and harbour construction). This product captures both the intra and inter-annual variability and changes. The permanent water surfaces (100% occurrence over 36 years) are represented in blue, and areas where water sometimes occurs are shown in shades of pink to purple (0% < occurrence < 100%). The paler shades are areas where the water occurs less frequently. The map can support better informed water-management decision-making.
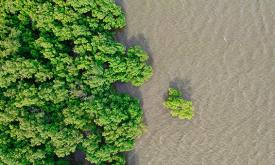
Mangroves are trees or shrubs adapted to saline and brackish environments. They are found in the intertidal zone of tropical and sub-tropical coastlines. Mangrove forests are among the most productive ecosystems on earth. They serve many important functions, including water filtration, prevention of coastal erosion, carbon storage, food, timber and livelihood provision, and biodiversity protection (as they provide habitat, nurseries, and feeding grounds for a vast array of organisms). Despite their incredible value, mangrove forests are destroyed and degraded at a rate of about 1% per year as a result of land use change, exploitation, coastal development and climate change. This layer shows the change in mangrove extent -either stable, gain or loss- between 1996 and 2016.
The hydropower installed capacity indicates the amount of energy a hydropower plant can produce in its turbines. In 2016, hydropower accounted for 54% of the installed capacity in Eastern Africa, 58% in Central Africa and 30% in Western Africa with fourteen countries having a hydropower share above 50% and eight countries above 70%. These highly hydropower-dependent countries are particularly prone to electricity cuts due to the lack of water caused by severe droughts. This map shows the location and installed capacities of hydropower plants above 5MW installed capacity in Africa for year 2016, representing 95% of the total hydropower installed capacity in Africa.
Water is a critical natural resource for both natural ecosystems and human subsistence. Some of the most immediate pressures on land that lead to degradation include diversion of surface waters and the removal of groundwater reserves to meet agricultural, industrial and domestic demands. This layer displays the areas of concern for water use related issues derived from the convergence of global evidence of human-environment interactions that can have consequences on land degradation. It highlights areas where the total water withdrawal (by the agriculture, industrial and domestic sectors) exceeds 40% of the total available annual renewable water supply. This layer is part of the World Altas of Desertification
Increasing water scarcity and water quality issues are serious constraints, especially for Northern Africa. A comprehensive assessment of spatial and temporal precipitation frequency is the initial step for defining public policies relating to water resources management and environmental monitoring. In the agricultural sector, a detailed knowledge of precipitation patterns is necessary to identify the most appropriate crop varieties for the region and to effectively manage climate related uncertainties. Precipitation frequency is also a central source of information for hazard mitigation and management. This layer represents the average variability of precipitation (L-CV) around the annual mean value for the period 1981-2017. The larger the L-CV, the more variable the annual precipitation is from year to year.
Chlorophyll-a concentrations (Chla) are an indicator of phytoplankton abundance and biomass in open waters. They can be an effective measure of trophic status and are commonly used to measure water quality. This layer compares the Chla value from the last full month with the long-term mean Chla. A positive anomaly (warm colours) means the monthly Chla is higher than the long-term average for that month; a negative anomaly (cool colours) means it is lower than the average.
Monitoring of sea surface temperature (SST) provides fundamental information on the global climate system and for the study of marine ecosystems. This layer compares the SST value of the last full month with the long-term mean SST. A positive anomaly (warm colours) means the monthly SST is warmer than the long-term average for that month; a negative anomaly (cool colours) means it is cooler than the average.
The Marine Ecoregions of the World is a global system to classify the oceans, helping to plan and prioritise marine conservation measures. How much are marine areas are protected at ecoregion level? For each African marine ecoregion, this map shows the percentage covered by protected areas.